Getting Started with Datastripes

Welcome to Datastripes! Whether you're here to explore data, create dashboards, or automate complex pipelines — this guide will help you get started with confidence.
Let’s walk through the key concepts, then build your very first flow.
What Is a Flow?
At the heart of Datastripes is the Flow — a visual pipeline where your data comes to life.
Imagine drawing out your data logic step by step. Sources feed data into nodes, which shape and transform it. The result? Clean outputs you can visualize, present, and share.
Flows are not static diagrams — they run, update, and respond in real time.
Understanding the Core Concepts
Before we build anything, here's a quick tour of what makes Datastripes tick:
Sources
These are your data origins — SQL databases, CSV files, APIs, or even real-time event streams.
Nodes
Each node in your flow performs a task: filter, group, join, visualize, or transform.
Assistants
Built-in AI that helps you analyze, troubleshoot, and understand your data — right inside the editor.
Plugins
Extend Datastripes with custom features, integrations, or visualizations tailored to your needs.
You’ll also encounter Dashboards and Slideshows — powerful ways to turn your flow into something interactive and presentable.
Let’s Set Things Up
Setting up Datastripes takes just a few steps:
- Install the app (see the project’s README for instructions)
- Open Datastripes and sign in or create your account
- Click New Flow to begin
Once you’re in, the editor opens to a blank canvas — your playground.
Building Your First Flow
Let’s create something.
Start by choosing a Source. You might connect a SQL query, paste in plain data, or point to a public dataset URL.
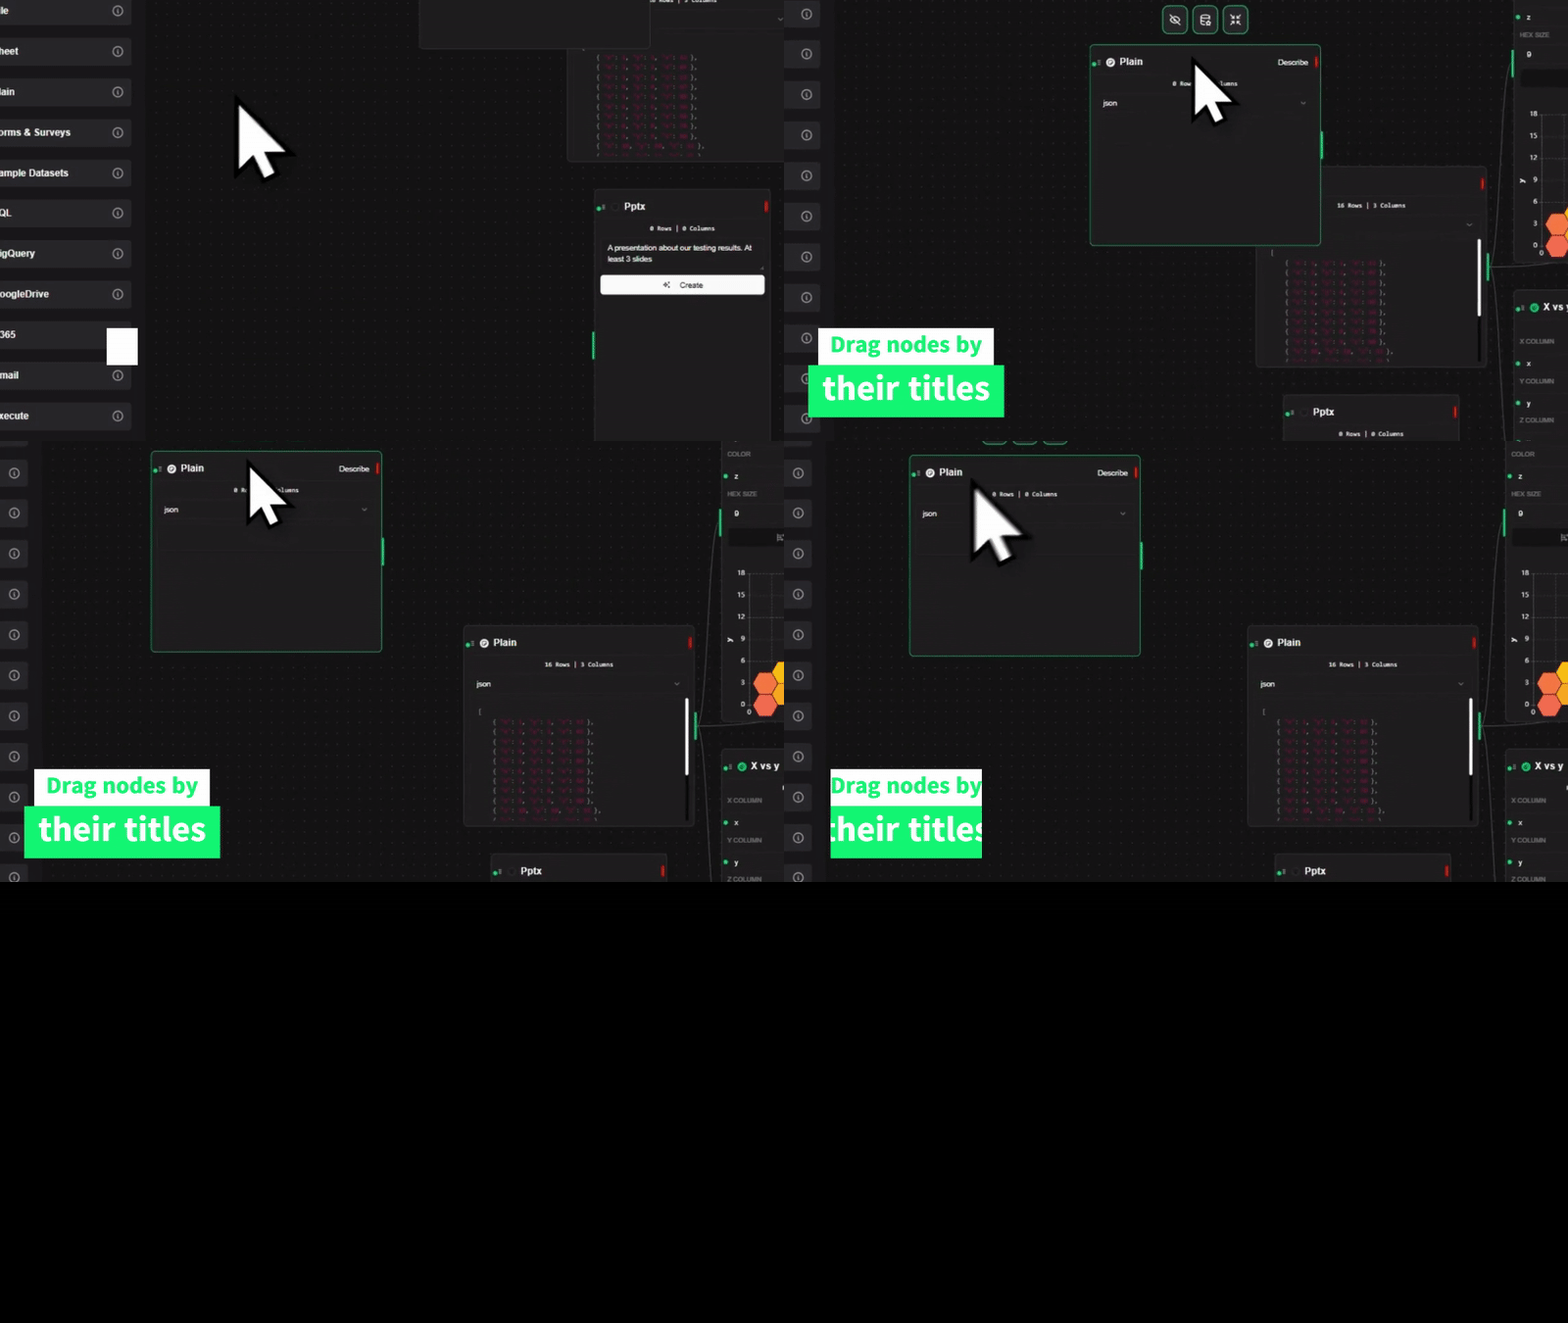
Next, drag a few Nodes onto the canvas. Maybe filter out unwanted rows, or compute a new column. Connect the dots. Watch the data flow through each step.
Then, choose your output. A Chart? A Table? Or go big — create a Dashboard or a Slideshow.
You’ve just built your first visual pipeline.
Need a Hand? Ask the Assistant
If you ever feel stuck or just want a second opinion, click the Assistant icon.
Type in a question like:
"What’s the distribution of ages in this dataset?"
Or:
"Suggest a chart for comparing revenue over time."
The Assistant will offer answers, suggestions, or even generate nodes for you — all context-aware, and focused on your flow.
Exploring Plugins
Need more flexibility? Head to the Plugins tab.
You can browse and install plugins created by others, or build your own to support new data types, nodes, or output formats. Each plugin can be enabled or disabled per project.
Plugins let you shape Datastripes to fit your workflow, not the other way around.
Dashboards and Slideshows
Ready to present your insights?
Turn your flow into a live-updating Dashboard, ideal for sharing trends and metrics with your team.
Or convert it into a Slideshow, which walks your viewers through the flow step by step, like a story — complete with charts, text blocks, and commentary.
Sharing and Collaboration
Collaboration is built-in.
Once your flow is ready, you can generate a shareable link. Choose whether viewers can comment, edit, or just watch. Perfect for teams, clients, or public reports.
All dashboards and slideshows stay in sync with their underlying flows — so updates happen automatically.
Where to Go Next
Datastripes is vast — but it’s easy to grow with.
Here’s what we recommend checking out next:
- Flows — Learn the full power of visual data pipelines
- Nodes Overview — Understand what each node does
- Dashboards — Build and customize visual reports
- Plugins — Extend the platform for your use case
“Start simple. Let your data flow.”